How do we use wastewater viral levels to understand risk and guide our activities?
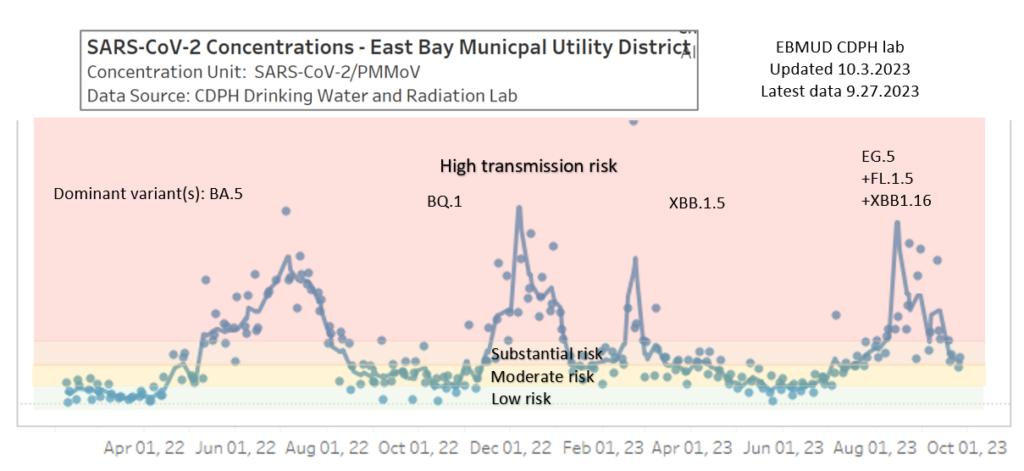
- The first graph above shows how wastewater data correlates with CDC transmission risk levels.
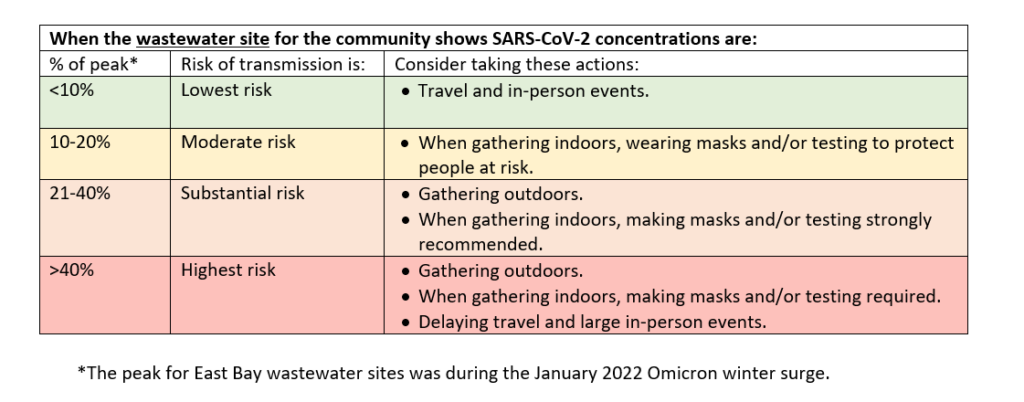
- The second chart above shows prevention actions to consider taking for each level of risk.
- For example, when we are in the highest risk level:
- Stay home when sick.
- Gather outdoors instead of indoors when possible.
- When indoors, open windows/doors and turn on air filters to maximize ventilation, wear masks and test before gathering to prevent transmissions.
Find the latest wastewater levels in the East Bay: CalSuwers (aggregated data with slight delays) | WastewaterSCAN | Biobot | CDC (aggregated data with longer delays)
Wastewater FAQs: Feces Facts! 💩
- Why use wastewater data? Wastewater viral levels capture virus shed by a large population and can provide a more accurate picture of how much virus there is in the community and thus transmission risk. Case counts have become less accurate because fewer people are getting the PCR tests that reported as cases.
- Why not use CDC hospital levels to guide activities? Changes in CDC positivity, emergency visit and hospital levels tend to lag wastewater data by about 2-4 weeks. By the time these CDC levels are high, viral transmissions would have been high for a month, and it’s much harder to prevent transmissions at that late point. Basically:
- If your goal is to prevent hospitals from getting overwhelmed and you’re OK with a moderate to substantial risk of infection, then following the CDC levels is sufficient.
- If your goal is to prevent infections and long Covid, then follow the wastewater levels.
- What are the dots and lines in the graph? The dots represent the viral concentration result for a specific date, and the line takes an average and connects it to create a trend line. When the dots for a given week are very far apart (for example, one dot in high risk and one dot in moderate risk), you could decide to follow the highest risk dot and be extra cautious … or you could look at the overall trend line and follow the average risk level.
- What communities are included in the EBMUD wastewater data? You can see the map on the CalSuWers dashboard, among with data from other (smaller) East Bay sewer sites. The EBMUD sewershed includes northwestern Alameda County (Oakland flatlands down to Hayward) and the southwestern part of Contra Costa County. Unfortunately, there is no unified East Bay graph.
- How can we tell how recent the wastewater levels are?
- On the WastewaterSCAN and Biobot dashboards, find the region you want levels for, then hover over the line graph to see the data of the data point.
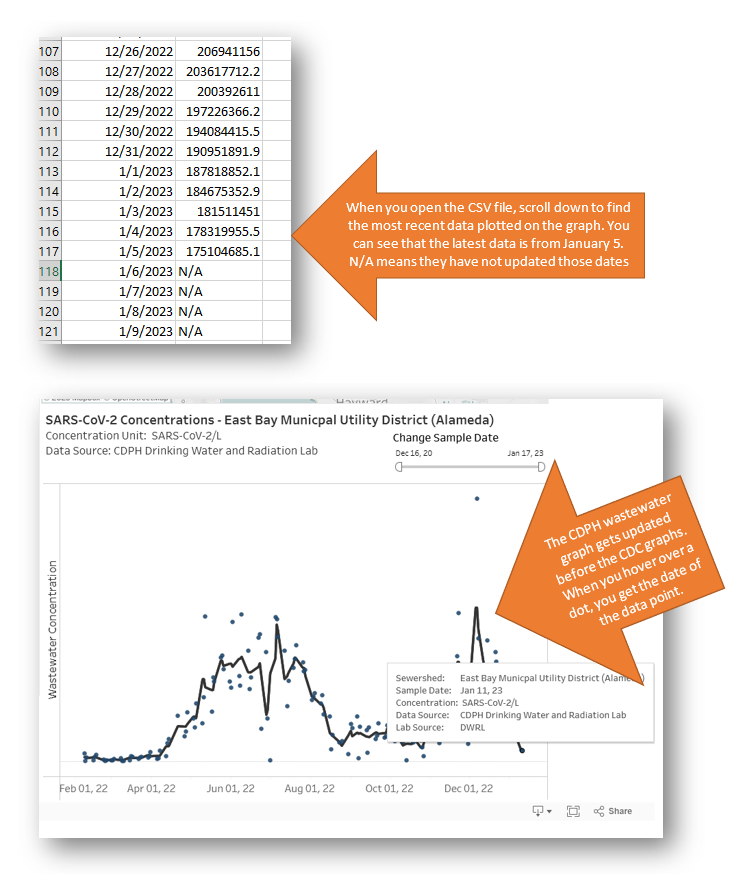
- On the CA wastewater dashboard graph, hover over a dot to see the date of the data point. COVID wastewater data flow from the sewer site –> lab –> CA –> CDC.
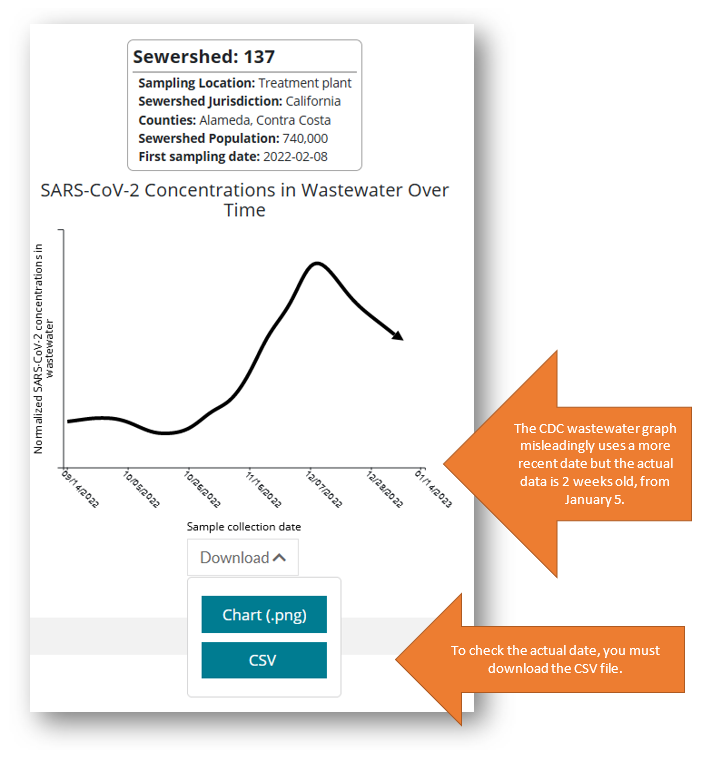
- On the CDC wastewater dashboard, finding the true dates for wastewater levels is tricky. Below is an infographic showing you how to check the actual dates. The CDC unfortunately labels its graphs with the date the general dashboard was updated (January 14) rather than the actual wastewater level date. In order to check the actual date, you must download the CSV file using the “download” button below the graph. Then scroll down the CSV file to find the most recent data plotted on the graph. You can see that the latest data is from January 5. “N/A” means they have not updated levels for those dates yet.